The climatology of large precipitation events is a critical component of engineering design and regulations for structures and facilities that must withstand or protect against such events. These events can produce localized and widespread flooding with damage to property, degradation of water quality, and potential loss of life.
Several studies have been completed that analyze daily extreme precipitation statistics for the Northeast US. These include Technical Papers 40 (1961) and 49 (1964), NOAA Atlas 14 Volume 2 (2004) and the Northeast Regional Climate Center's Extreme Precipitation in New York & New England project (2011). Because each project uses a different statistical methodology, a different period of record, and different data sets, it is impossible to analyze intrastudy trends in the extreme precipitation statistics.
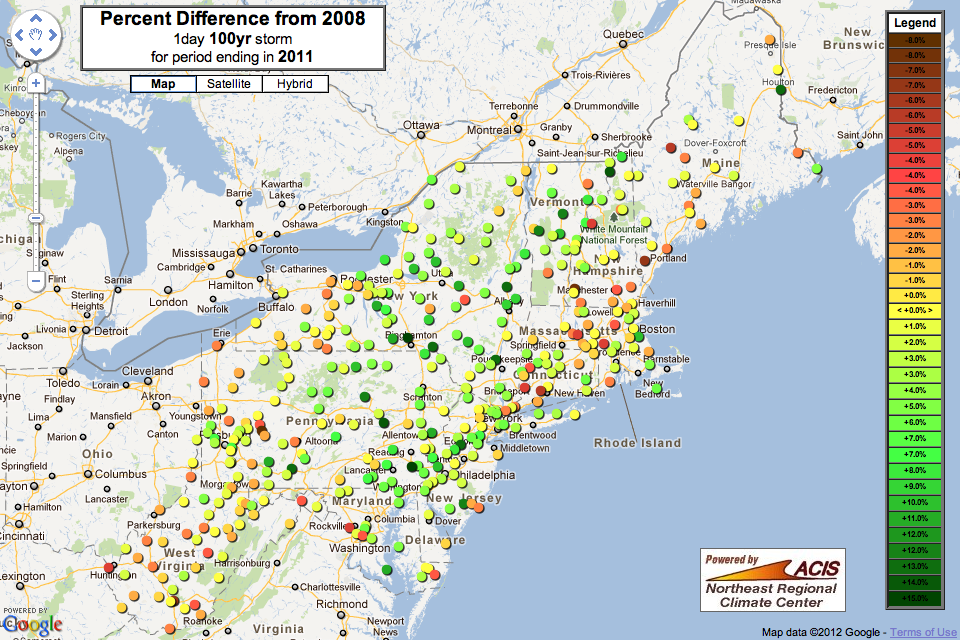
The ambitious goal of this project is to use the same methodology employed in NRCC 2011 to calculate extreme precipitation return periods for the past, and also allow for annual reanalysis as new years of rainfall data are made available. The results have been plotted as a series of maps and graphs, depicting the 1day storm amount at recurrences of 2, 5, 10, 25, 50, and 100 years. The analysis was repeated to create separate periods of record ending in each year from 1958 to present. This allows for analysis of trends, and examination of potential impacts due to climate change.
Please note that while the methods used within this site are the same as our previous study, it is advised that you not use these results for hydrologic design or analysis. Instead, please use the static data from the NRCC 2011 project, available in a variety of graphical and text formats.
MAP: Spatial analysis of extreme precipitation trends for a given year for all stations in the Northeast US.
GRAPH: Temporal analysis of extreme precipitation trends for a given station for periods with end years from 1958 to present.
Return Period Amount: The maximum 1day precipitation amount expected within a given recurrence interval (return period). Recurrence intervals used in this project are 2yr, 5yr, 10yr, 25yr, 50yr, and 100yr.
Recurrence of 2008 Storm: Shows the recurrence interval that the 2008 return period amount would have if it occurred in the selected year.
Percent Change: The relative difference between a given year's return period estimate and the 2008 estimate (period of record for the NRCC 2011 project).